Home
About TBLA
Company Profile
Vision and Mission
Corporate Values
Our Policy
Shareholding
Organizational Structure
Management
Competitive Advantages
Awards
Other Information
Article of Association
Head Office / Factories / Subsidiaries
Products
Product Review
Product Mix
Operations
Plantation Profile
Production Capacities
Investor Relations
Information of General Meeting of Shareholder / General Meeting of Bondholder
Financial Statement
Financial Highlights
Quarterly Newsletter
Investor Presentation
Analyst Coverage
Annual Report
Sustainability Report
Dividend History
Share Listing History
Debt Listing History
Prospectus
GCG
Committees
Internal Audit
Corporate Secretary
Supporting Institutions
Code Of Conduct
Wishtleblowing System
Risk Management
The Board of Directors & Commissioners Charter
The Board of Directors Charter
The Board of Commissioners Charter
Work Guidelines Committee
Risk Management Committee Charter
The Nomination and Remuneration Committee
Internal Audit Charter
Audit Committee Charter
Policies
POLICY OF COMMUNICATION WITH SHAREHOLDERS OR INVESTORS
POLICY OF PROCEDURES FOR RESIGNATION OF DIRECTORS AND BOARD OF COMMISSIONERS IF INVOLVED IN FINANCIAL CRIMES
POLICY OF SUPPLIER AND VENDOR SELECTION AND UPGRADING
POLICY OF DIRECTORS AND EMPLOYEES’ REMUNERATION PT TUNAS BARU LAMPUNG TBK
POLICY OF PERFORMANCE ASSESSMENT BOARD OF COMMISSIONERS AND DIRECTORS
POLICY OF ANTI-CORRUPTION AND ANTI-FRAUD
POLICY ON THE FULFILLMENT OF CREDITOR RIGHTS
CSR
Social Responsibility Policy
Corporate Philosopies & Principles for Business Sustainability
Career
Contact
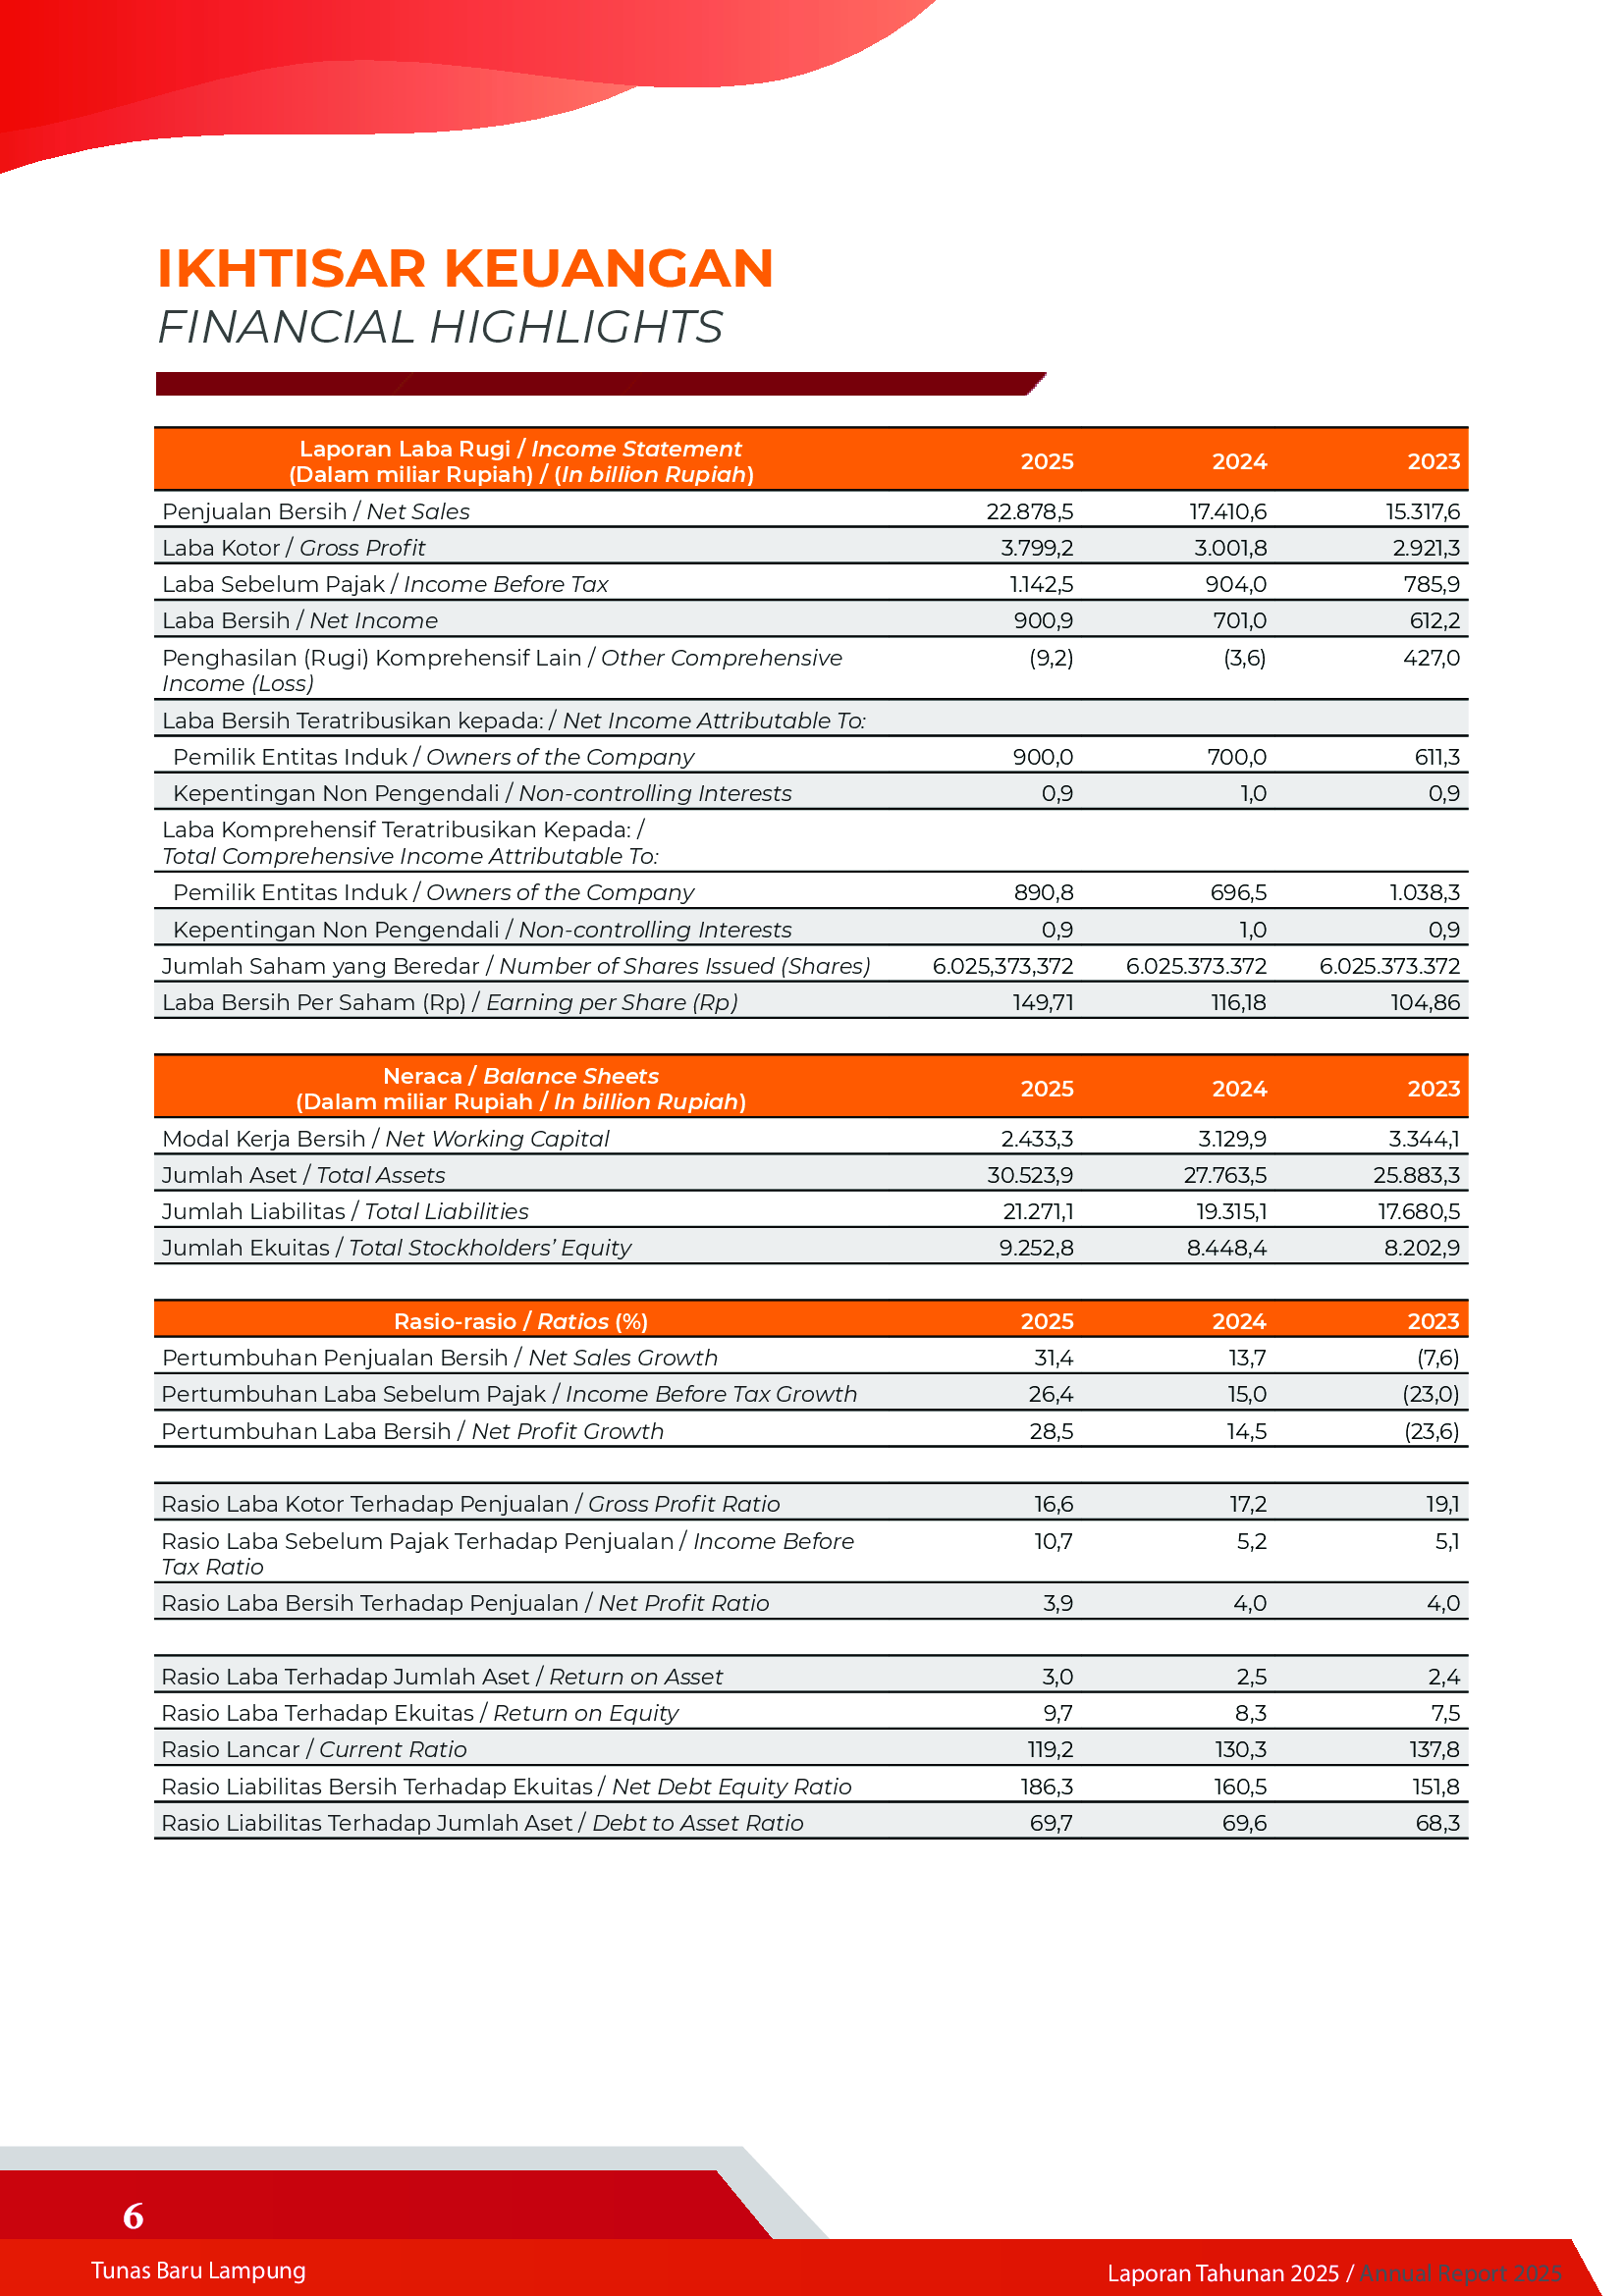
Financial Highlights
Investor Relations
Information of General Meeting of Shareholder / General Meeting of Bondholder
Financial Statement
Financial Highlights
Quarterly Newsletter
Investor Presentation
Analyst Coverage
Annual Report
Sustainability Report
Dividend History
Share Listing History
Debt Listing History
Prospectus